Crop Residue Estimator
Crop Residue Estimator
Soil conservation specialists recommend that farmers maintain at least 30% soil cover throughout the year to reduce farmland topsoil and nutrient losses that impact water quality. Available crop residue level measurement methods are labourious and time consuming. Farmers, agricultural specialists and researchers need a reliable, convenient and rapid residue measurement tool. Today’s handheld mobile devices are equipped with digital cameras and global positioning systems (GPS) and provide the potential to assess crop residue coverage. This is a prototype application that has been constructed to work on Android tablets and is freely available to test and use. We welcome all feedback and comments on the approach. It is our plan to incorporate the crop residue estimator into future versions of FarmHand™.
The goals of the project were to:
- Demonstrate/pilot an innovative mobile application technology that will provide the farmers who manage large portions (~70%) of the province’s cropland (i.e. corn, soybean, dry bean, wheat and other grains) with the means to evaluate their crop residue cover easily.
- Increase a farmer’s ability to make informed tillage decisions.
- Provide farmers with a convenient means of recording the results of the soil and water conservation practices applied on their farms (crop residue cover after planting).
- Take advantage of mobile computing/communication technologies (tablets, smart phones) that are already being purchased and used by landowners for other farmrelated activities, to collect and organize their field level operations.
- Provide opportunities for farmers to collaborate with researchers and government agencies to assess progress concerning on-farm soil and water conservation efforts.

Abstract
The Ontario Ministry of Agriculture, Food and Rural Affairs (OMAFRA) recommends that farmers maintain at least 30% soil cover throughout the year to reduce farmland topsoil and nutrient losses that impact water quality. Available crop residue level measurement methods are labourious and time consuming. Farmers, agricultural specialists and researchers need a reliable, convenient and rapid residue measurement tool. Today’s handheld mobile devices (tablets and smart phones) are equipped with digital cameras and global positioning systems (GPS). This mobile technology provides an opportunity for crop residue cover assessment application (“app”) development. This pilot project tested and calibrated this new method against existing techniques and demonstrate it to farmers with the aid of OMAFRA staff. Eventually, all Ontario farmers interested in measuring their field crop residue levels will be able to download this mobile application. They will also have the option to contribute their results to a common data warehouse.
Project Descriptioin
Soil erosion results in non-point source pollution of receiving waters. Eroded sediments carry productive topsoil, nutrients and pesticides off farmland to impair streams, lakes and shoreline waters. This remains an environmental concern, not just in the Great Lakes region, but globally. Tillage and planting systems that leave a protective cover of plant residue on the soil surface have been shown to reduce soil losses from cropland. They are among the least costly erosion control practices available to farmers (Dodd et al, 1989). Crop residue cover acts as a protective shield for the soil surface. It helps to protect the soil particles from the erosive forces of raindrop impact, rainfall and snowmelt runoff, and wind. Through time, as these crop residues decompose, organic matter levels in the topsoil increase. This improves soil structure and health. These surface residues slow surface water flow. Fewer tillage passes on fields may result in less compaction. The resulting improved soil structure leads enhanced infiltration into the soil. Residue cover can also reduce soil evaporation losses. This conserves soil moisture. For these reasons, many regard soil residue management as a key climate change adaptation strategy. It provides resiliency to cope with the anticipated more intense, yet infrequent, rains in the Summer growing season, prolonged plant moisture stress conditions and the need for increased water efficiency.
The ability of a tillage or planting system to maintain soil residue cover is currently measured by using one or more of the following methods:
- Line transect method (e.g. knotted rope)
- Meter stick method
- Photo comparison method
- Calculation method
- Photographic grid method
Each of these techniques, described more completely by Dodd et al. (1989), has various advantages and disadvantages. A common feature of each, however, is that they tend to be labourious and time-consuming to complete properly. For this reason, few landowners actually measure their field residue levels. As a consequence, there is not good documentation with which to assess whether or not cropland residue levels are improving or declining through time. As a result, the progress of agricultural land managers and the successes of policies and programs aimed at tackling soil erosion mitigation, reducing rural non-point source pollution loadings, and adapting to climate change, are not easily quantified. This project aims to develop and test a tool that takes advantage of today’s widespread availability and adoption by the farm community of handheld devices, equipped with cameras and GPS. It will provide for convenient and rapid crop residue cover estimation.
Reference List: Dodd, V. A., Grace, P.M., Dickey, E.C., Shelton, D.P., Meyer, G.E. and Fairbanks, K.T. 1989. Determining crop residue cover with electronic image analysis. Biological Systems Engineering; Papers and Publications. Paper 238.
This project was supported by the following partners:

Overview Guide

Step 1 - Home View
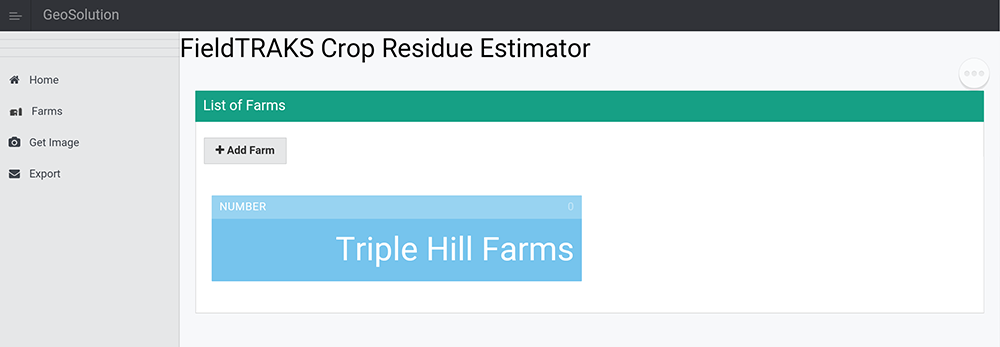
Select the Farms icon on the home page and create a farm. If a farm and field have already been created then you can select the Image button to proceed to Step 4 where you will be selecting the image source.
Step 2 - Create Farm
You can add multiple farms. It is necessary to add a Farm name. It is optional to add any additional data since these are not currently used.
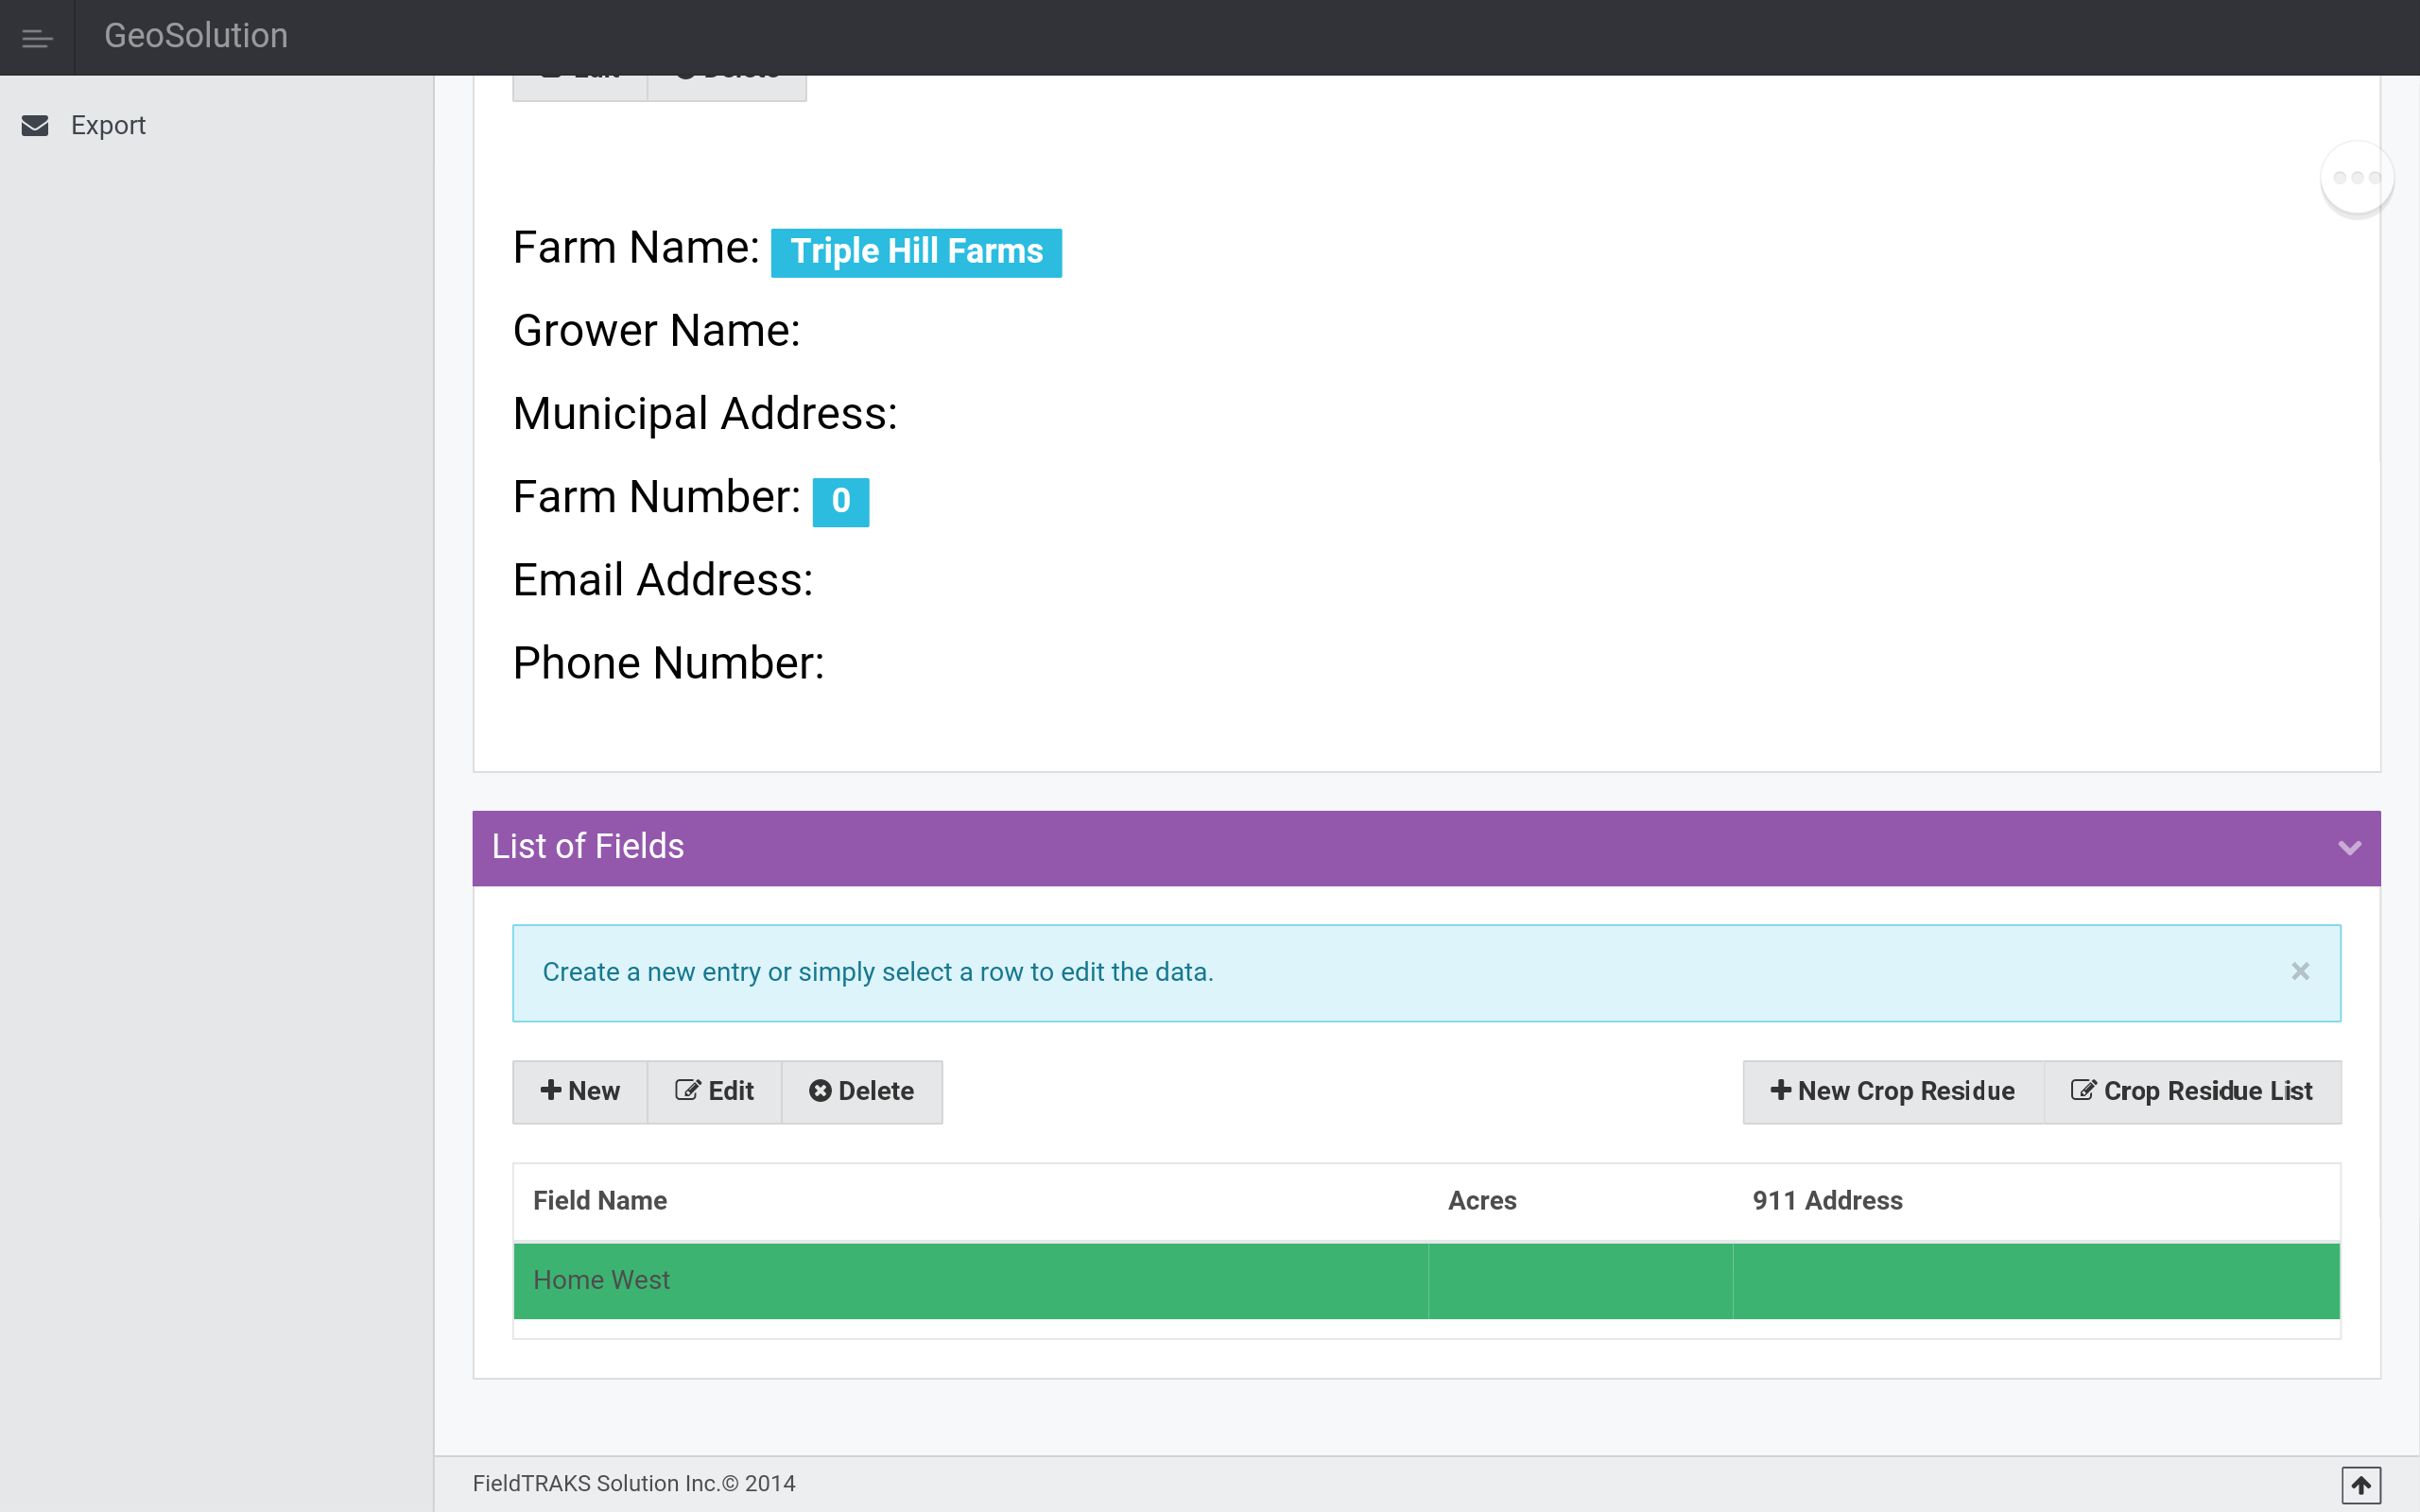
Step 3 - Add Field
Pan to the bottom of the page and select 'New' to create a field.
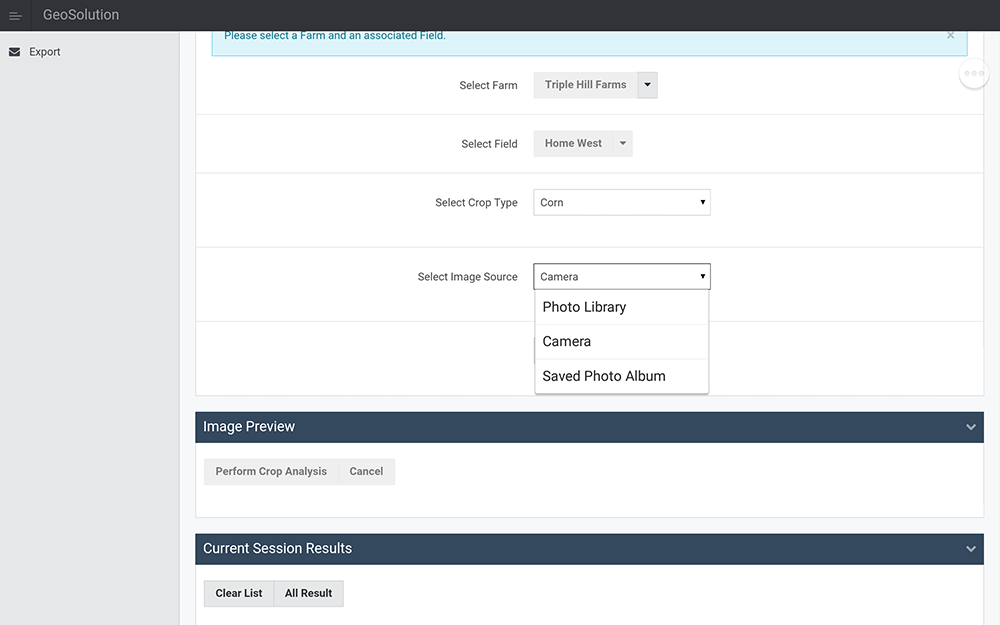
Step 4 - Select Image Source
Images can either be selected from existing images in the photo library or captured using the device camera.
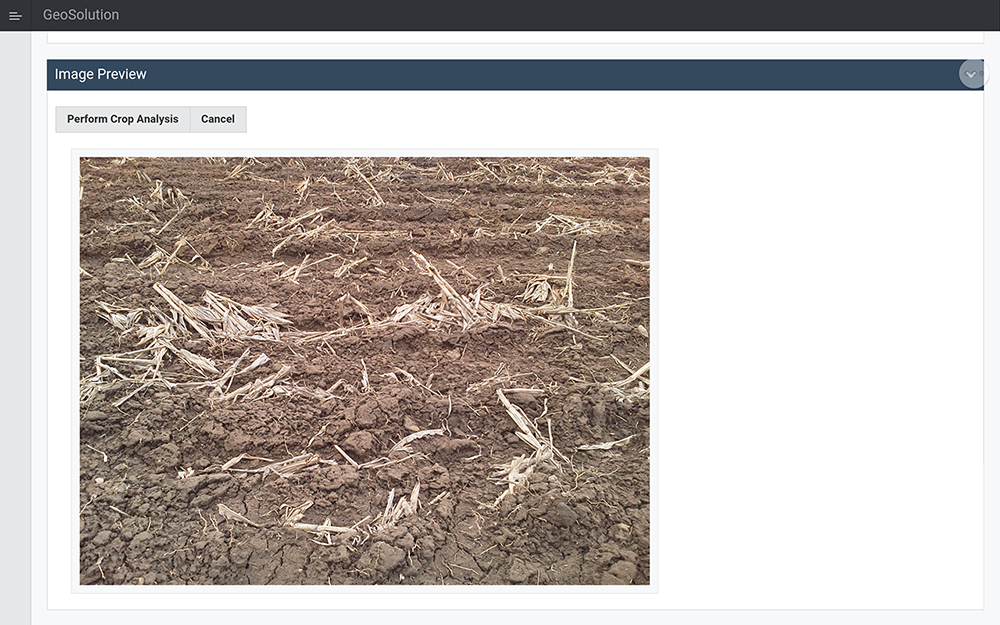
Step 5 - Image Preview
Once an image is selected it will be displayed in the Image Preview section.
Select the 'Perform Crop Analysis' button.
Step 6 - Identify Sample Targets
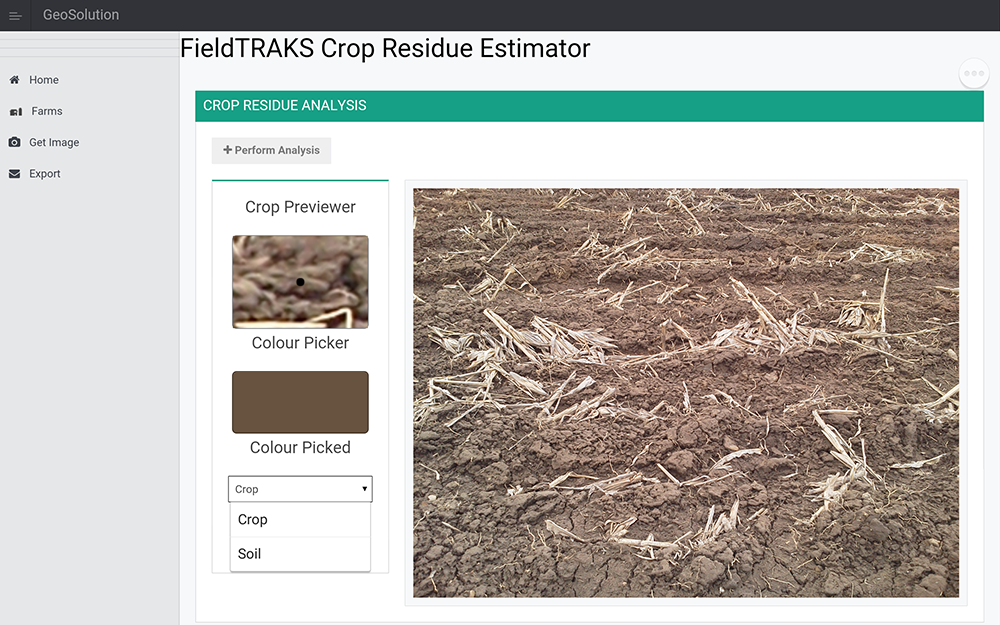
The analysis works by looking for colour ranges that identify either crop or soil areas. Select the target type from the drop-down menu and then identify points on the image that represent the selected target type.
Sample sites are selected by tapping on the large image and then tapping the selected colour (in the colour picked window).
The crop preview window shows a magnified view of the current location. Tap on different locations of the image to select a new colour.
Step 7 - Pick Multiple Target Areas
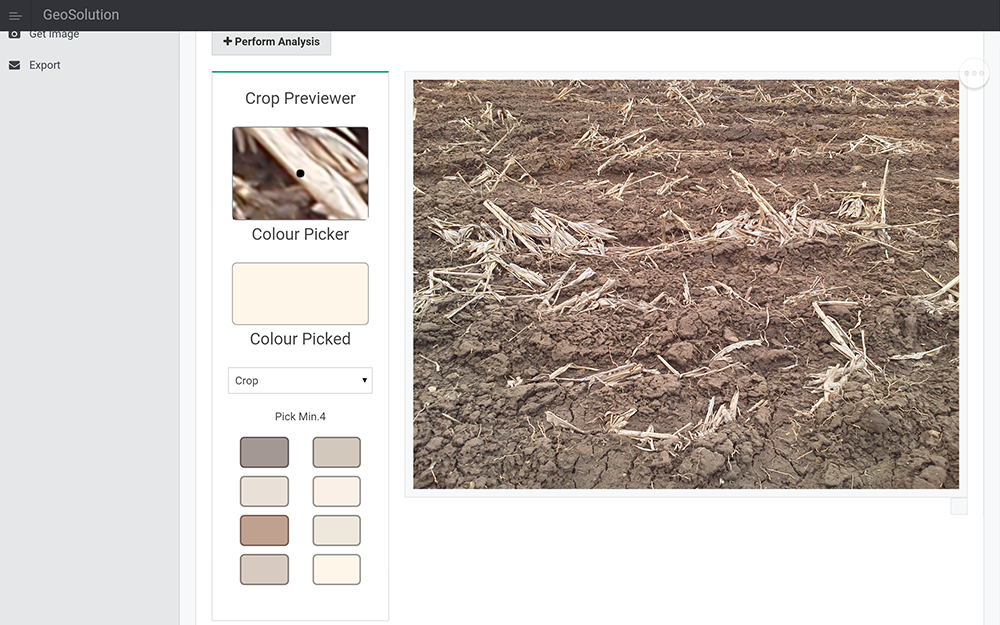
Add additional sample locations to the colour palette.
A minimun of 4 colours is required.
Once the desired number of samples area have save, select 'Perform Analysis' at the top of the page.
Step 8 - Analyze Results with Transparency
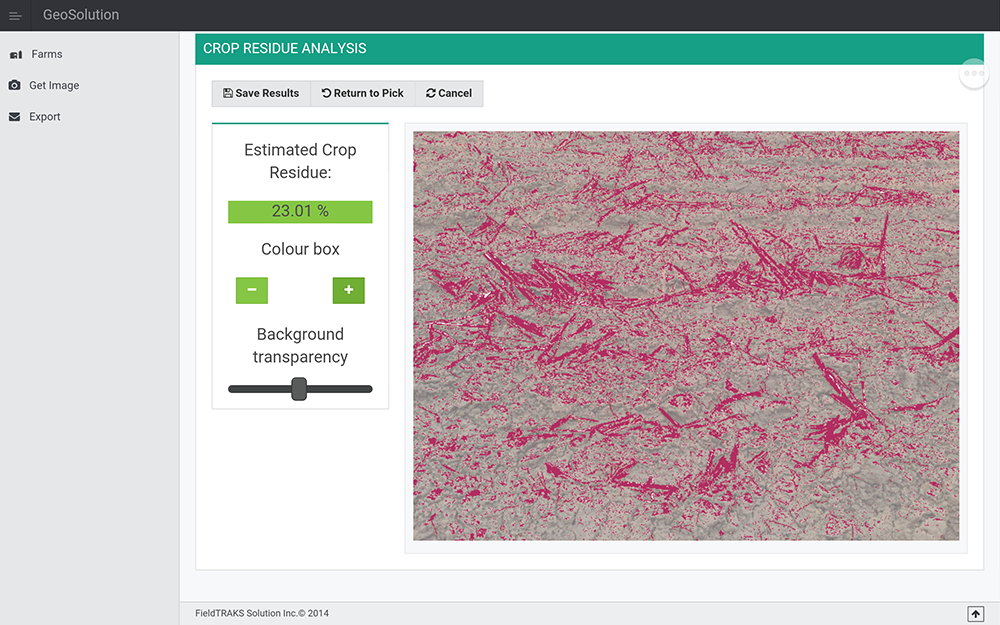
A one colour image is generated showing the areas identified as crop residue based on the colour profile created.
You can adjust the transparency between the result image and the original image using the Background Transparency slider.
Step 9 - Adjust Sample Tolerance
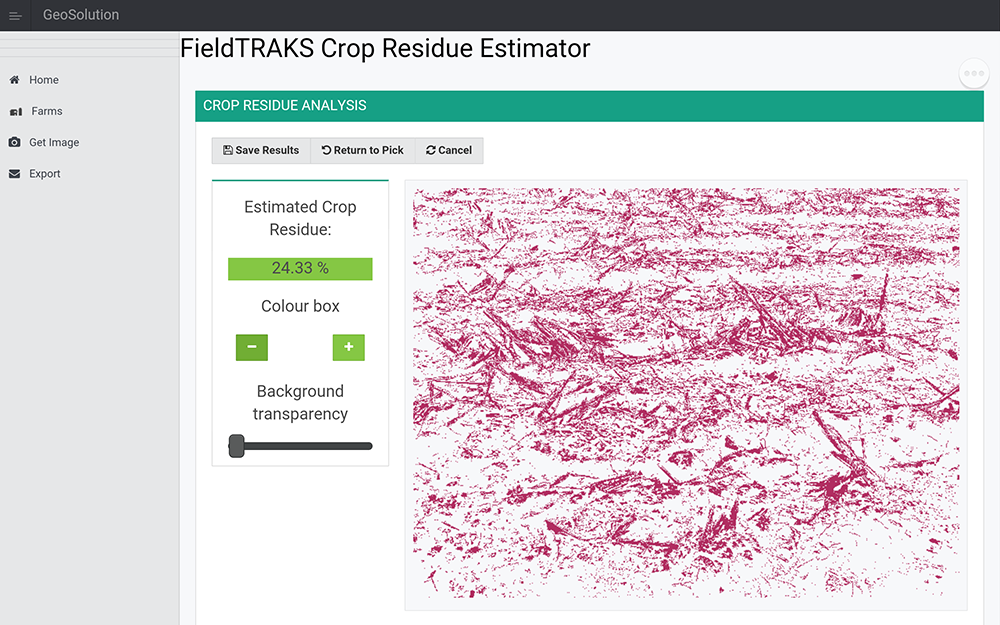
Use the + and - buttons for the colour box to increase or decrease the range of colours selected.
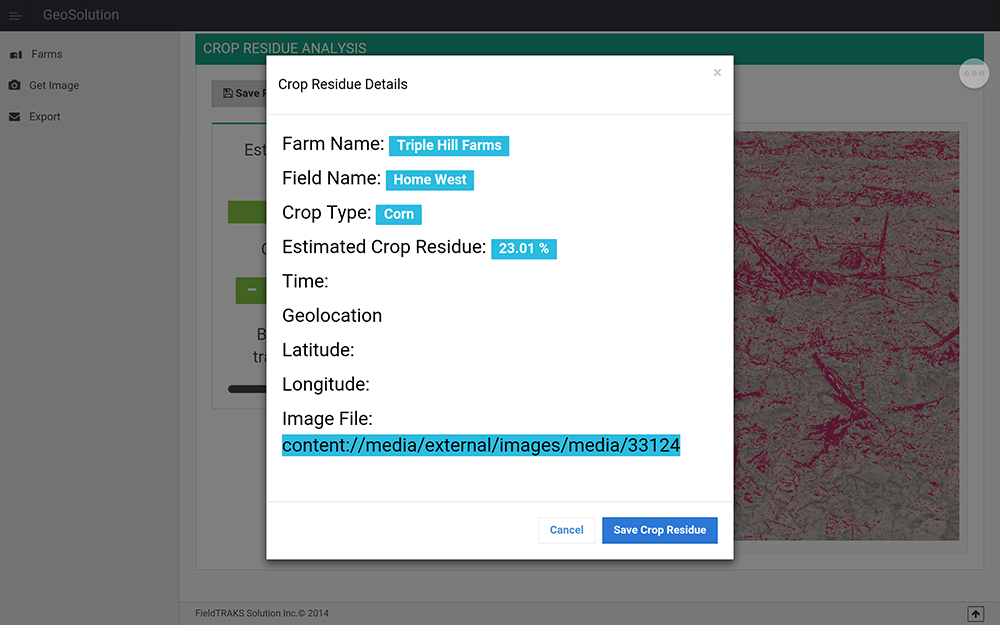
Step 10 - Save Results
Save the results.
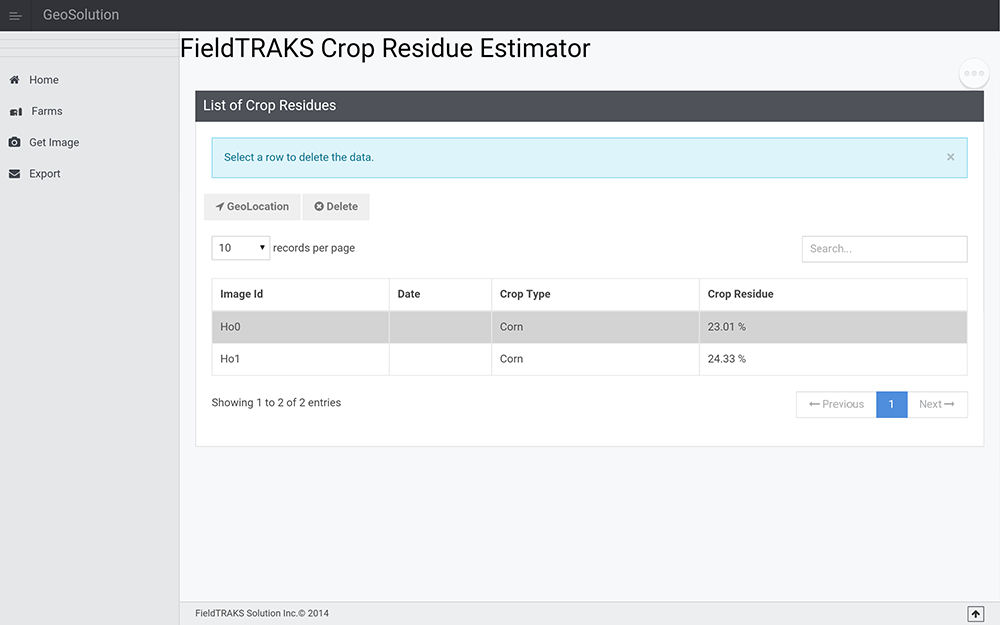
Step 11 - View Results
View table listing all samples collected for the field.
Crop Residue Measurement App for Androids
Requirements:
- Android Version 4.0 and above
- Enable Camera
Download Sample Image